Scaling & Performance on Heroku
If you expect your Tabbycat site to gain lots of traffic — either because it has lots of participants or will be followed by lots of people online — there are a number of strategies to ensure that it will remain fast despite this attention. This is typically only necessary for very large tournaments that will display information on the public-facing version of your Tabbycat site; and even then only minor amounts of ‘scaling’ are needed at particular moments. However, if your site does become slow you want to know what to do and how to do it ahead of time in order to prevent disruptions.
By default, a Tabbycat installation runs on Heroku’s free tier. This is a resource-constrained environment and improving performance will typically require paying for higher levels of Heroku services. These services are billed on a per-minute (not monthly) basis, meaning that if you make use of any upgrades mentioned below, you will only be billed for the actual duration used — i.e. if an upgrade is listed at $100/month, but you only use it for 4 hours, the final bill will be around $0.50. As such you can make use of high-performing resources just when they are needed, without needing to pay the full monthly price to maintain the resource indefinitely.
Note
This page was largely written before a number of improvements in the 2.2 release of Tabbycat that have significantly increased traffic capacity. Its recommendations may be overly cautious given these improvements.
Note
Scaling for performance reasons is a separate issue to that of upgrading the database capacity of your tab which just provides the ability to store data. That said, typically only tournaments that are large enough to need an upgraded database will be the ones that ever need to consider scaling for performance anyway.
Introduction to Scaling
Heroku’s primary resource is that of a ‘dyno’. Each dyno can be thought of as running a copy of Tabbycat. Following the ‘many hands make light work’ principle, running a greater number of dynos will generally improve the ability of your site to serve lots of pages simultaneously because traffic is divided up amongst all of the available dynos. In normal circumstances most Tabbycat pages on the public site are served by Heroku in under a second; however they can take noticeably longer than that when the quantity of incoming traffic exceeds the capacity of the existing dyno(s) to serve it. In such cases the delay accrues because the excess page loads need to first wait for an available dyno in addition to the standard wait for a page to be processed and transferred to the user.
Thus scaling is almost always a process of increasing throughput in order to decrease the chance that any page load needs to wait in order to be served by a dyno. On the flip side, having extra dynos or upgraded dynos won’t make Tabbycat itself run any faster in general — they are essentially wasted unless there is sufficient large amounts of traffic that a single dyno cannot serve all of it without creating a queue.
Dynos can be scaled by adding more dynos (‘horizontally’) or by adding upgraded dynos (‘vertically’). In general, horizontal scaling should be the first and most effective strategy — the problem traffic causes is due to concurrency or lots of people loading lots of pages all at once. The traffic on Tabbycat sites typically fluctuates a lot, with moments of high intensity clustering around draw releases, round advances, and the final tab release. As such you generally only need to scale your dynos for very short periods of time.
In order to increase the number of dynos you first need to be using at least the Standard 1X level of dyno. Once set the Heroku Dashboard will show you a slider that can be used to increase the dyno count. While dynos higher than the Standard 1X level may help serve pages a tiny bit faster, having more dynos is far more effective than having upgraded dynos. Upgrading beyond Standard 1X is generally only required if you need additional memory (as described below) or want to use auto-scaling (also described below).
Note
There should be no need to increase the number of ‘worker’ dynos. While ‘web’ dynos are responsible for serving traffic, the worker only handles a few rare tasks such as serving email and creating allocations.
At large tournaments you should always upgrade your existing ‘Free’ dyno to a ‘Hobby’-level dyno. This upgrade is crucial as it will enable a “Metrics” tab on your Heroku dashboard that provides statistics which are crucial to understanding how your site is performing and how to improve said performance. If you are at all unsure about how your site will perform it is a good idea to do this pre-emptively and keep an eye on these metrics over the course of the tournament.
Note
If pages are not loading it could be due to two things: your site being overloaded with traffic, or a bug in Tabbycat itself. Generally, if you see a generic or Heroku-branded ‘application error’ page that means it is the former problem, whereas a Tabbycat-branded page indicates the latter.
Scaling Dynos
Once you have upgraded your dyno to the Hobby level, the metrics tab provides a number of graphs that can be used to help identify how your site is performing. The first graph, Events provides an overview of any problems that are occurring:
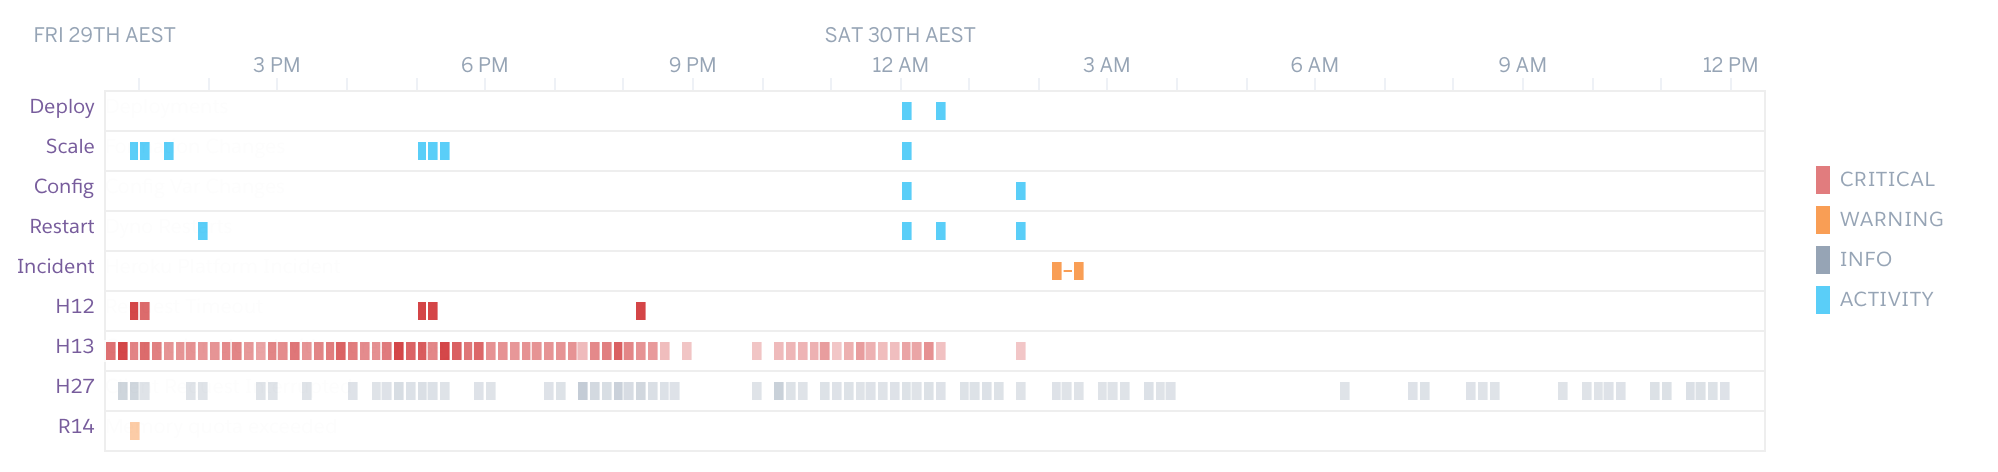
Red marks, or those labelled Critical typically indicate some sort of problem. H13 errors are a good measure of the amount of pages failing to load during heavy traffic, however they can be triggered under normal conditions — you want to check how many are occurring within a given time period and ensure its more than a handful.
Response Time & Throughput
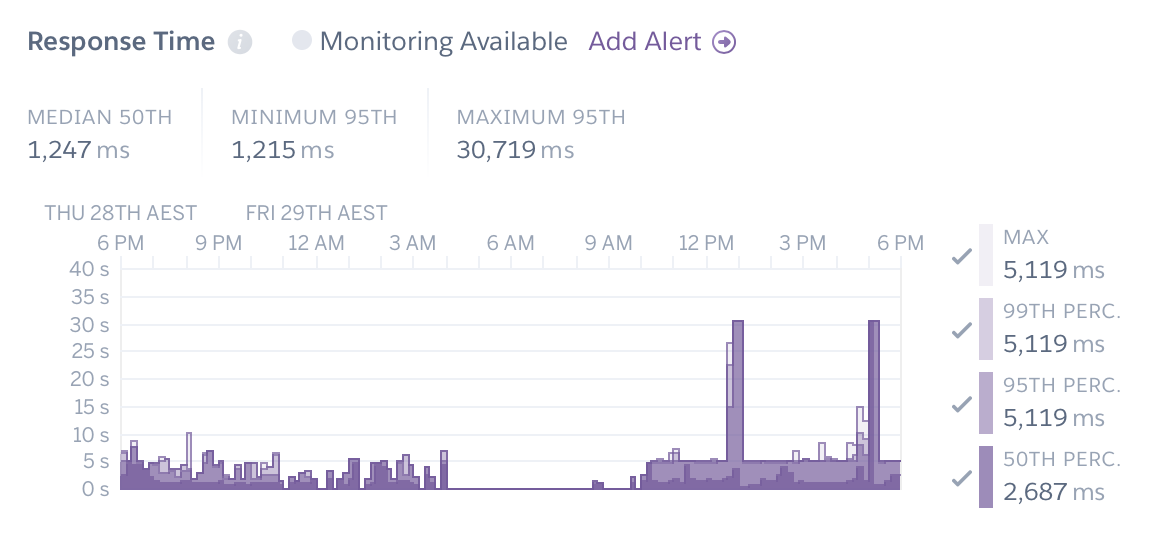
The response time is the amount of time it takes a dyno to load a page and serve it to your users. Smaller response times are thus good, and long response times (over fifteen seconds) indicate that a site is struggling to serve its content due to a large amount of queueing.
Heroku dynos have a maximum response time of 30 seconds, at which point they will stop serving the request. To users this appears as an error page or as a page that never loads. Thus if you see the graph is at or approaching 30 seconds at any point you need to try and diagnose what is causing this and add more resources to reduce the response time.
Note
You can toggle the percentiles in this graph. Problems are much more severe if it affects the 50th percentile which represents a site that is probably not loading for the majority of its users. There are also a couple of Tabbycat functions (like automatic adjudicator allocation) that naturally take 10-20 seconds which means that the maximum or 99th percentile metrics are not very reflective of general traffic.
Closely related to this is the Throughput graph (further down) which shows how many pages your site is serving per second. Normally this is not particularly interesting, however note that the red part of the bar graph shows the amount of failed page requests. Like the Response Time graph, this can indicate issues with the site — normally this red portion should be well below 1rps (and ideally 0rps). If it is above 0.5 it represents a site that is producing a significant number of failed page loads.
You can verify if pages are not being served to users by checking the Events graph and looking for H12 errors, although occasionally they are not reported properly. A large amount of H13 errors can also be a cause for concern.
Dyno Load
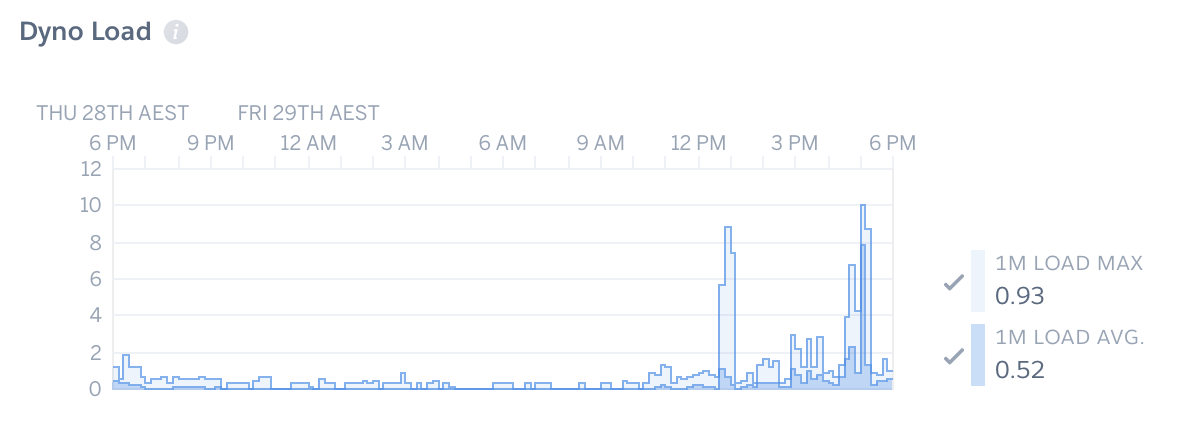
This graph shows how well your dynos are being utilised. It is scaled relative to the total number of dynos you are running (or have run previously). So if you have 10 dynos and the bar graph is near the ‘10’ this shows that each dyno is being utilised 100% (either on average over a 1-minute period or as the maximum use over a 1-minute period).
If this bar graph is hitting the top it will usually mean that a site that is slow or failing to load pages — if each dyno is busy it can’t serve a new page until it is finished. This issue can often compound, with more traffic coming in than it is possible to serve and clear.
If your average, rather than maximum, dyno load is approaching the upper limit of however many dynos you are running now (remember the y-axis will often exceed however many dynos you are currently running) that is a very good sign that you should increase the quantity of dynos being run. Continue adding dynos and evaluate how this effects load so that the bar is not hitting its limit.
If you are consistently needing to scale things (or having previously had issues and are expecting a very heavy burst of traffic) it may be worth upgrading to the Performance-M dyno type, which will then allow you to enable the Auto-scaling feature. This will automatically add dynos as needed to cope with traffic, and remove them when they become unnecessary. This is very effective; however, note that this dyno-type is $250/month per dyno and will self-add dynos (within an upper limit you can specify). While this is not a huge price on a per hour/minute basis (even running 10 for an hour is only $4) you definitely want to ensure you keep a close eye on it and turn it off when it is not necessary. Note that it also tends to be quite aggressive in how many dynos it ‘thinks’ you need — you may want to increase the default response time threshold to prevent it scaling so quickly.
Memory Usage
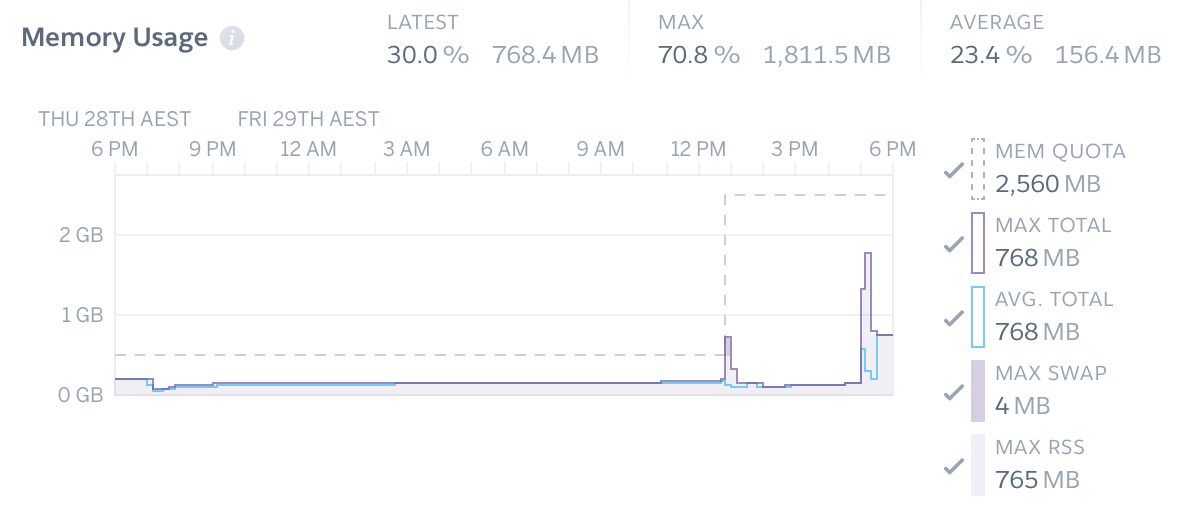
It is very rare that Tabbycat sites will hit the memory limits of the Free or Hobby level dynos — its almost always hovering around 256MB of the (standard dyno) limit of 512MB. However, if the graph is approaching the dashed line you may want to first restart the dynos (in the More dropdown in the upper-right) and see if that resolves it.
You can also confirm that memory limits are causing the app to fail by checking for the presence of R14 errors in the Events chart. If your site continues to come very close to that memory limit you will want to upgrade your dynos to the higher level dynos which have increased memory.
Alerts
If the site is really struggling to perform its usually relatively obvious. However, if you want to be pre-warned of this, or just ensure things are as fast as possible, you can use the “Configure Alerts” feature on the Metrics page to receive emails when things are getting slow. We would recommend creating a Response Time Threshold warning of 15000ms and a Response Requests Percentage Threshold of 5%.
Understanding Caching
When a page is ‘cached’ it means that Tabbycat has stored a copy of the final output of the page. It can then send that copy directly to a user who is loading that page without needing to go through the normal process of fetching the data from the database, running any calculations, and formatting the results. Pages that are cached will serve quickly — if a page is taking more than a few seconds to load it usually means that page has not been cached (or your site is having too much traffic to serve pages quickly in general). The downside is that changes to the underlying data won’t update until the cache has ‘expired’ and is regenerated. So, for example, a cached copy of the draw will not immediately reflect change to panels and a newly-release motion or tab page will not show up in the menu immediately.
By default Tabbycat caches public pages according to three levels: a 1-minute timeout, a 3.5-minute timeout, and a 2-hour timeout. The only pages on the 2-hour timeout are those that come with a full tab release — such as speaker standings, the motions tab, etc. Public pages that need to update quickly, such as the draw and homepage, are on the 1-minute timeout to ensure data is up to date. Public pages that update less frequently such as Standings, Results, Participants, and Breaks are on the 3.5-minute timeout.
Caching means that a Tabbycat site should actually perform faster when it is being viewed by many people at once, as the caches are constantly up-to-date and can be used to serve the majority of requests. When there is less traffic the caches are more likely to be regenerated each time someone goes to a page resulting in slower page loads. Most often performance problems come when a popular page, such as a newly-released draw gains a large amount of traffic suddenly (such as by people constantly refreshing the draw). If the page hasn’t finished caching it has to do a full page calculation for each of those new loads, which will spike the amount of resource use until the page load queue is cleared.
One way to help mitigate this is to try and load those pages first yourself to ensuring the cache is populated before other people access it. To do so you would generally open a new private browsing tab, and navigate to the specific page(s) immediately after you have enabled them. This may require going to the URL directly rather than relying on the homepage or menu (which may not have been updated to show the new information). In the case of draw releases, this can also be mitigated by not release online draws until they have been first shown on a projector (so that people aren’t trying to get draw information ahead of time).
You can also increase the 1-minute timeout for the pages that are popular during the in-rounds, by going to the Settings section of your Heroku dashboard, clicking Reveal Config Vars, and creating a new key/value of PUBLIC_FAST_CACHE_TIMEOUT and 180 (to set the timeout to be 3 minutes i.e. 180 seconds). This should only be necessary as a last resort. Turning off public pages is also an option.
If you ever need to clear the cache (say to force the site to quickly show an update to the speaker tab) you can install Heroku’s Command Line Interface and run the following command, replacing YOUR_APP with your site’s name in the Heroku dashboard:
$ echo "FLUSHALL\r\n QUIT" | heroku redis:cli -a YOUR_APP --confirm YOUR_APP
Postgres Limits
The free tier of the Postgres database services has a limit of 20 ‘connections’. It is rare that a Tabbycat site will exceed this limit; most Australs-sized tournaments will see a maximum of 12 connections at any point in time.
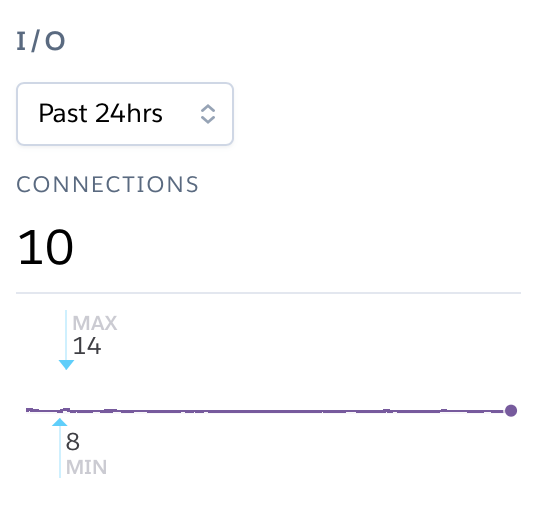
You can monitor this in your Heroku Dashboard by going to the Resources tab and clicking on the purple Postgres link. The Connections graph here will show you how close you are to the limit. The first tier up from the ‘free’ Hobby tiers (i.e. Standard-0) has a connection limit of 120 which can be used to overcome these limits if you do encounter them.
Redis Limits
Tabbycat uses two types of Redis add-on. The official Heroku Redis add-on is used to enable the pages of Tabbycat that display live information, such as the check-ins page, the adjudicator allocation page, and the round results page. The Redis Labs Heroku add-on is used to enable the caching of pages, as described above.
Both types of add-on have connection limits that, if hit, will degrade performance. However, in practice these connection limits are very rarely hit because connections are maintained extremely briefly, or only for very particular types of traffic. As with Postgres, you can click-through to each add-on to examine how close your site is to hitting this connection limit.
The default Redis Labs add-on has a connection limit of 30. This should be sufficient for almost all tournaments — only at WUDC-levels of traffic have we seen that limit breached (to a peak of 118). Upgrading the Redis Labs add-on to the first non-free tier expands the connection limit to 256. This upgrade should only be strictly required for WUDC, but is also a good precaution for EUDC/Australs scale tournaments.
The official Heroku Redis has a connection limit of 20. Even at WUDC’s scale the most connections ever observed were 13, so an upgrade should not be necessary.
Mirror Admin Sites
If you really want to be safe, or are unable to resolve traffic issues and unable to quickly complete tasks on the admin site, it is possible to create a ‘mirror’ of the tab site just for admin use. This site can be configured to share the same database as the primary site — meaning it is in effect always identical — but because it is at a separate URL it won’t have to respond to public traffic and so can’t be swamped with a large page load queue.
Warning
This requires some technical knowledge to setup and hasn’t been rigorously tested. It works fine in our experience but we haven’t tested it extensively. If using this make sure you backup (and now how to restore backups) before setting one up.
To do so you would deploy a new copy of Tabbycat on Heroku as you normally would. Once the site has been setup, go to it in the Heroku Dashboard, click through to the Resources tab and remove the Postgres and Redis Add-ons. Using the Heroku Command Line Interface run this command, substituting YOUR_APP with your primary tab site’s name (i.e. the app that you had initially setup before this):
$ heroku config --app YOUR_APP
Here, make a copy of the DATABASE_URL and REDIS_URL values. They should look like postgres:// or redis:// followed by a long set of numbers and characters. Once you have those, go to the Settings tab of the Heroku dashboard for your mirror tab site. Click Reveal Config Vars. There should be no set DATABASE_URL or REDIS_URL values here — if there are check you are on the right app and that the add-ons were removed as instructed earlier. If they are not set, then add in those values, with DATABASE_URL on the left, and that Postgres URL from earlier on the right. Do the same for REDIS_URL and the Redis URL. Then restart the app using the link under More in the top right.
Once you visit the mirror site it should be setup just like the original one, with changes made to one site also affecting the other as if they were just a single site.
Estimated Costs
As a quick and rough benchmark, here is a list of typical prices you would encounter if scaling to meet the performance needs of a high-team-count high-traffic tournament at the approximate scale of an Australs (~100 teams) or above. This is a probably an overly-conservative estimate in that it is based on tournaments run on the 2.1 version of Tabbycat. Versions 2.2 and above should perform dramatically better and thus have less need to scale using Standard and Performance dynos.
- 1x
Hobby Basic Postgres Plan($9/month) run all day for 14 days = ~$4
A tournament of this size will require an upgraded database tier for the time when you are adding new data; i.e. during registration and rounds. Once the tab is released (and no further data changes needed) however you can downgrade it back to the
Hobby Devtier.
- 1x
Hobby Dyno($7/month each) run all day for 7 days = ~$2
As recommended, 1 hobby dyno should be run as a baseline in order to see the metrics dashboard; but this can be downgraded a day or so after the tab has been released and traffic is sparse.
- 1X
Redis Labs 100mb Plan($10/month) run for 7 days = ~$2
The upgraded version of Redis is worth running as a precaution while the site is showing draws and the full tab
- 3x
Standard 1X Dyno($25/month each) run 10 hours a day for 4 days = ~$4
This higher quantity of dynos should only be necessary during traffic spikes (i.e. draw releases, immediately after round advances, and tab release) but unless you want to be constantly turning things on/off its usually easier just to upgrade them at the start of each day of in-rounds (or when the tab is published) and downgrade them at the end of each day. As mentioned earlier, you should occasionally check the Dyno Load in the Metrics area and adjust the number of dynos as needed.
Autoscaled Performance M Dynos($250/month each) average of 5 run for 1 hour = ~$2
For just round 1 it is a good idea to upgrade to the
Performance Mtier so you can enable auto-scaling and thus have the site automatically adjust the number of dynos to the amount of traffic it’s getting (rather than having to guess the number of dynos needed ahead of time). Doing so ensures that the first round runs smoothly and means that you can then review the Metrics graphs to see what your ‘peak’ load looks like and resume using whatever quantity ofStandard 1X Dynowill accommodate this peak load in future rounds.